Feb
Product analytics
More informative error messages added
Product Analytics Team

We hope you haven't ever seen the error message above, but if you have then we have good news: we've made it much more informative.
This error usually occurs either because a query was running for too long, or because a memory limit was hit. Both issues are generally caused by a query having an excessively large scope.
In either case, we'll now tell you exactly what the error was and give you some prompts on how to fix it. Of course, you can still raise a support request if needed!
SDKs
New Android and iOS SDKs released
Replay Team
After a short beta period, we've now released our Android and iOS SDKs into general availability, making them available for all users as version 3.0.0.
These SDKs are a complete rework of the old, legacy versions and are more efficient than they were previously. The Android SDK has been rewritten in Kotlin, while the iOS SDK is rewritten in Swift.
Both SDKs offer all the same features of the legacy versions, as well as some new functionality such as feature flag payload support. The iOS SDK also supports WatchOS and macOS for teams with products on those platforms.
React Native SDK now supports macOS target
Replay Team
Manoel continues to plug away at improving our React Native SDK and has now added support for the
macOStarget in addition to his previous work.There are still some things to be aware of when using the React Native SDK however, so be sure to check the docs for more information.
Jan
Session replay
Server timing reporting added to player inspector
Replay Team
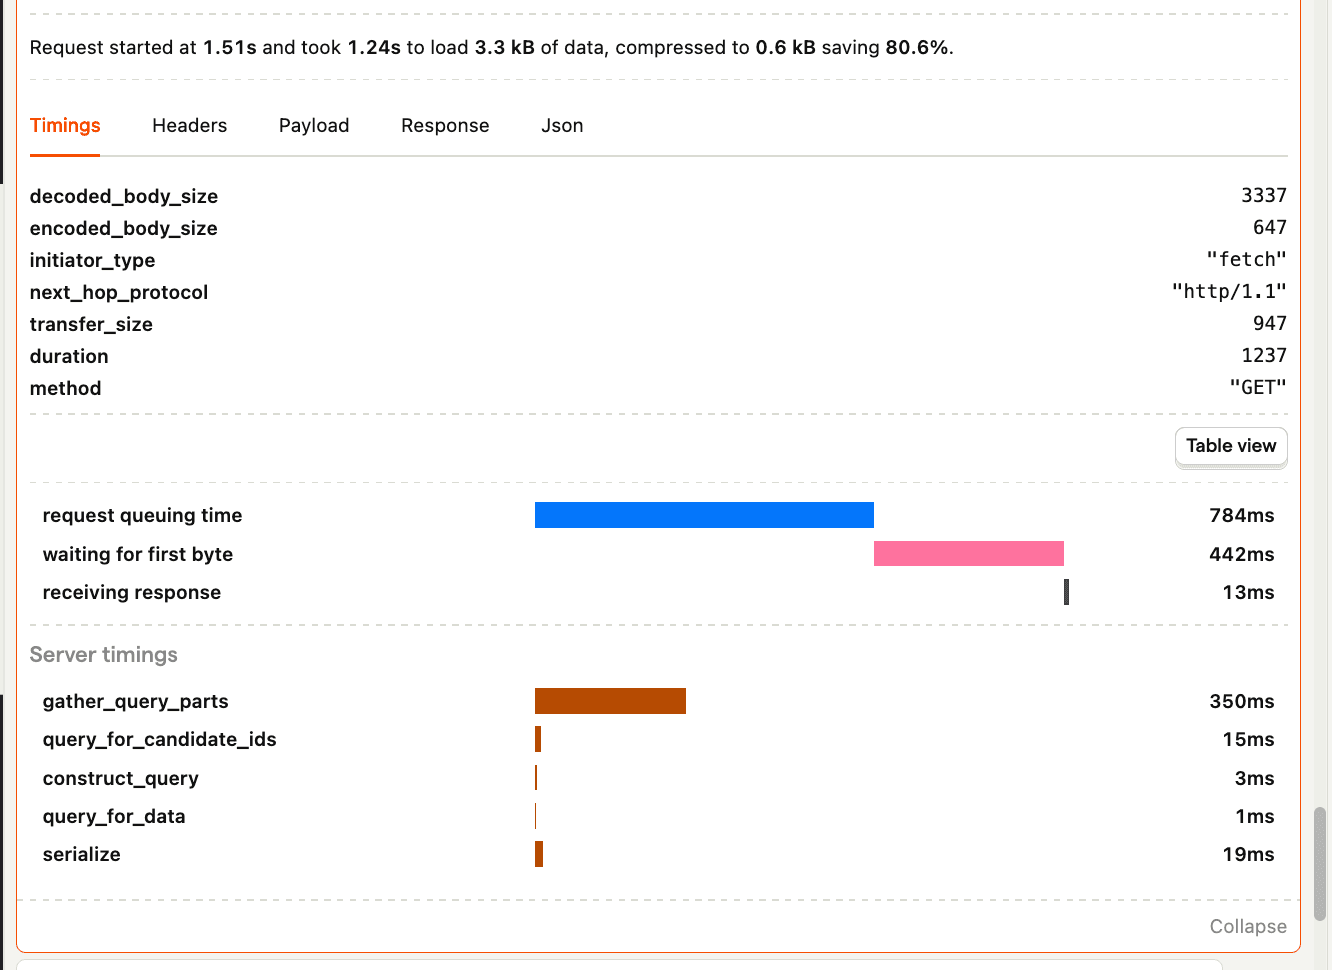
We now report server timings in the session replay player inspector, enabling you to see information about the request-response cycle.
In the image above, for example, you can see that we spent 442ms waiting for the first byte, 350ms of which was spent on
gather_query_parts.Server timings like this are helpful for going deep into performance issues and discovering where delays occur, so you know where to focus performance improvements.
Session replay
Browser network status reporting added to replays
Replay Team
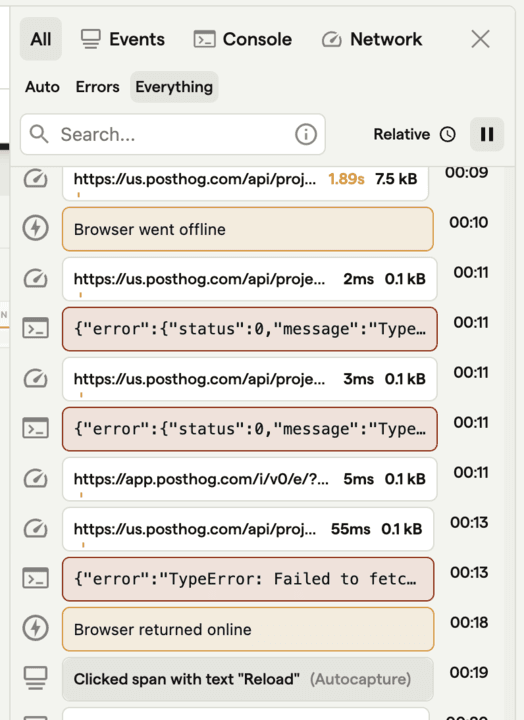
We've increased the amount of information session replay is able to capture about the network status of a user. You can now see the browser's reported network status while watching a replay.
This is typically going to be helpful if you're trying to debug or investigate certain types of error which a user may report as a result of losing their connection. Previously we wouldn't explicitly identify their offline status, which could have caused confusion - but now we do!
PostHog Flutter SDK now supports macOS
Replay Team
We have updated our Flutter SDK to support the macOS target, which it didn't previously. This is important if you use Flutter to deploy across multiple platforms - previously it wouldn't install at all.
Thanks to Manoel for work on this, though he believes the SDK should speak for itself in place of a longer update.
Configuration
React Native SDK now supports web target
Replay Team
We have updated our React Native SDK to version 2.10.2, adding support for the React Native Web target. Previously if you used the React Native SDK to deploy to web, it wouldn't work and would throw errors. Now it works seamlessly!
Thanks to Manoel for work on this SDK, who (still) believes the SDK should speak for itself.
Uncategorized
Severity selector added to in-app support
Customer Success Team
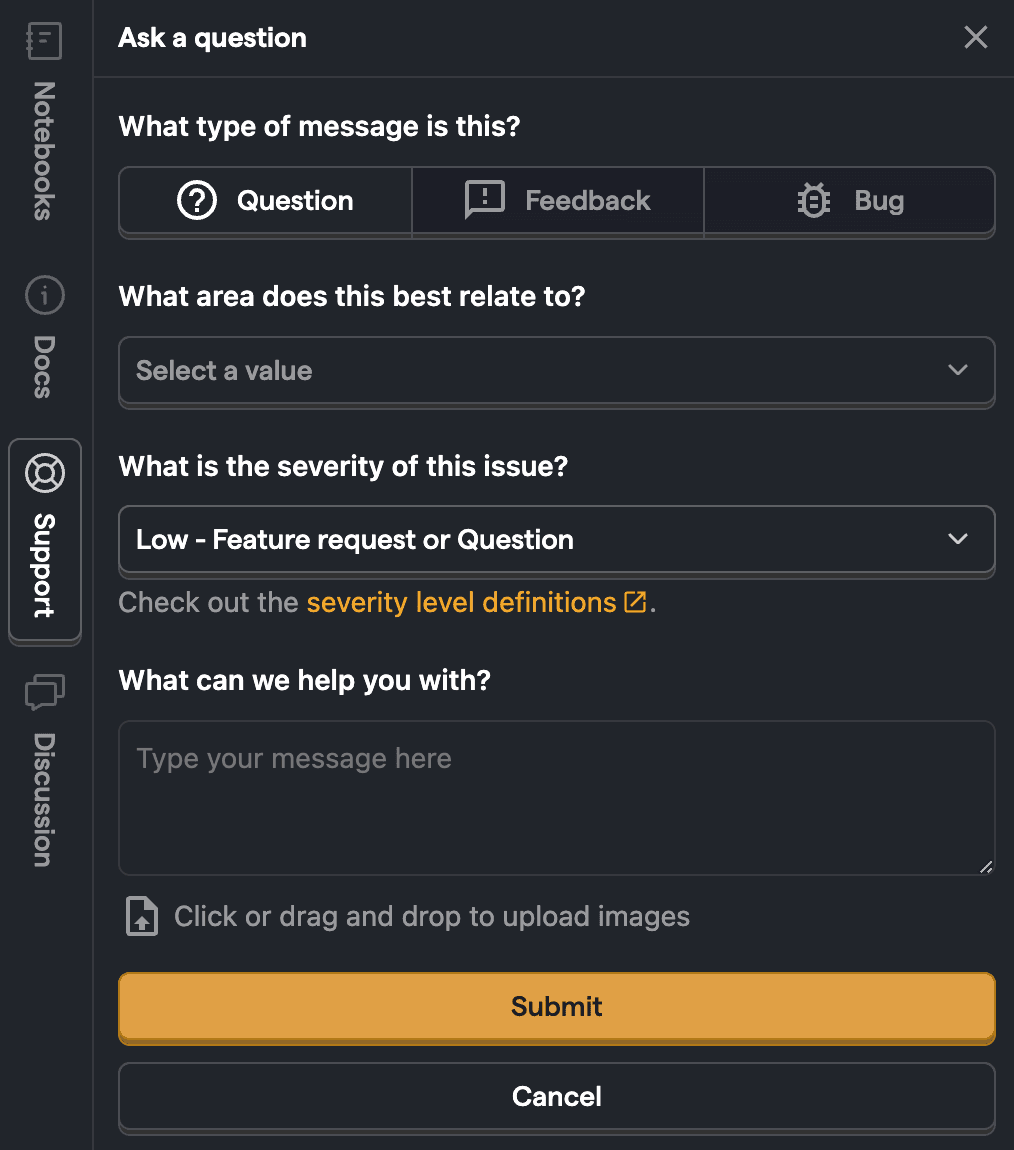
We're making a lot of improvements to the way we provide support at the moment. This includes publishing new FAQs to the forums, adding an automated CSAT email for closed tickets, and a new severity checker for the in-app support.
The severity checker will help us triage tickets by giving you the ability to self-select how critical the support enquiry is.
Is it a feature request or piece of feedback that isn't totally urgent? Or is it a critical security issue that we need to solve today? We hope it's not the latter.
Session replay
Network payload capture launched
Replay Team
Earlier this month we announced the first public beta of 2024, which enabled you to capture network requests and response payloads in session replay. Now, it's out of beta and available for everyone!
Network payload capture builds on top of the network calls and performance data we already capture using
PerformanceObserver, making it easier for you to understand performance issues and debug errors. Enable it in your Project Settings!Capture network requests and responses in session replay
Replay Team
We already capture network calls that are made and their performance data using the browsers' built-in PerformanceObserver. Adding capture of requests, responses, and status codes would allow our users to more thoroughly understand the behaviour of their applications.
Feature flag scheduling released
Feature Success Team
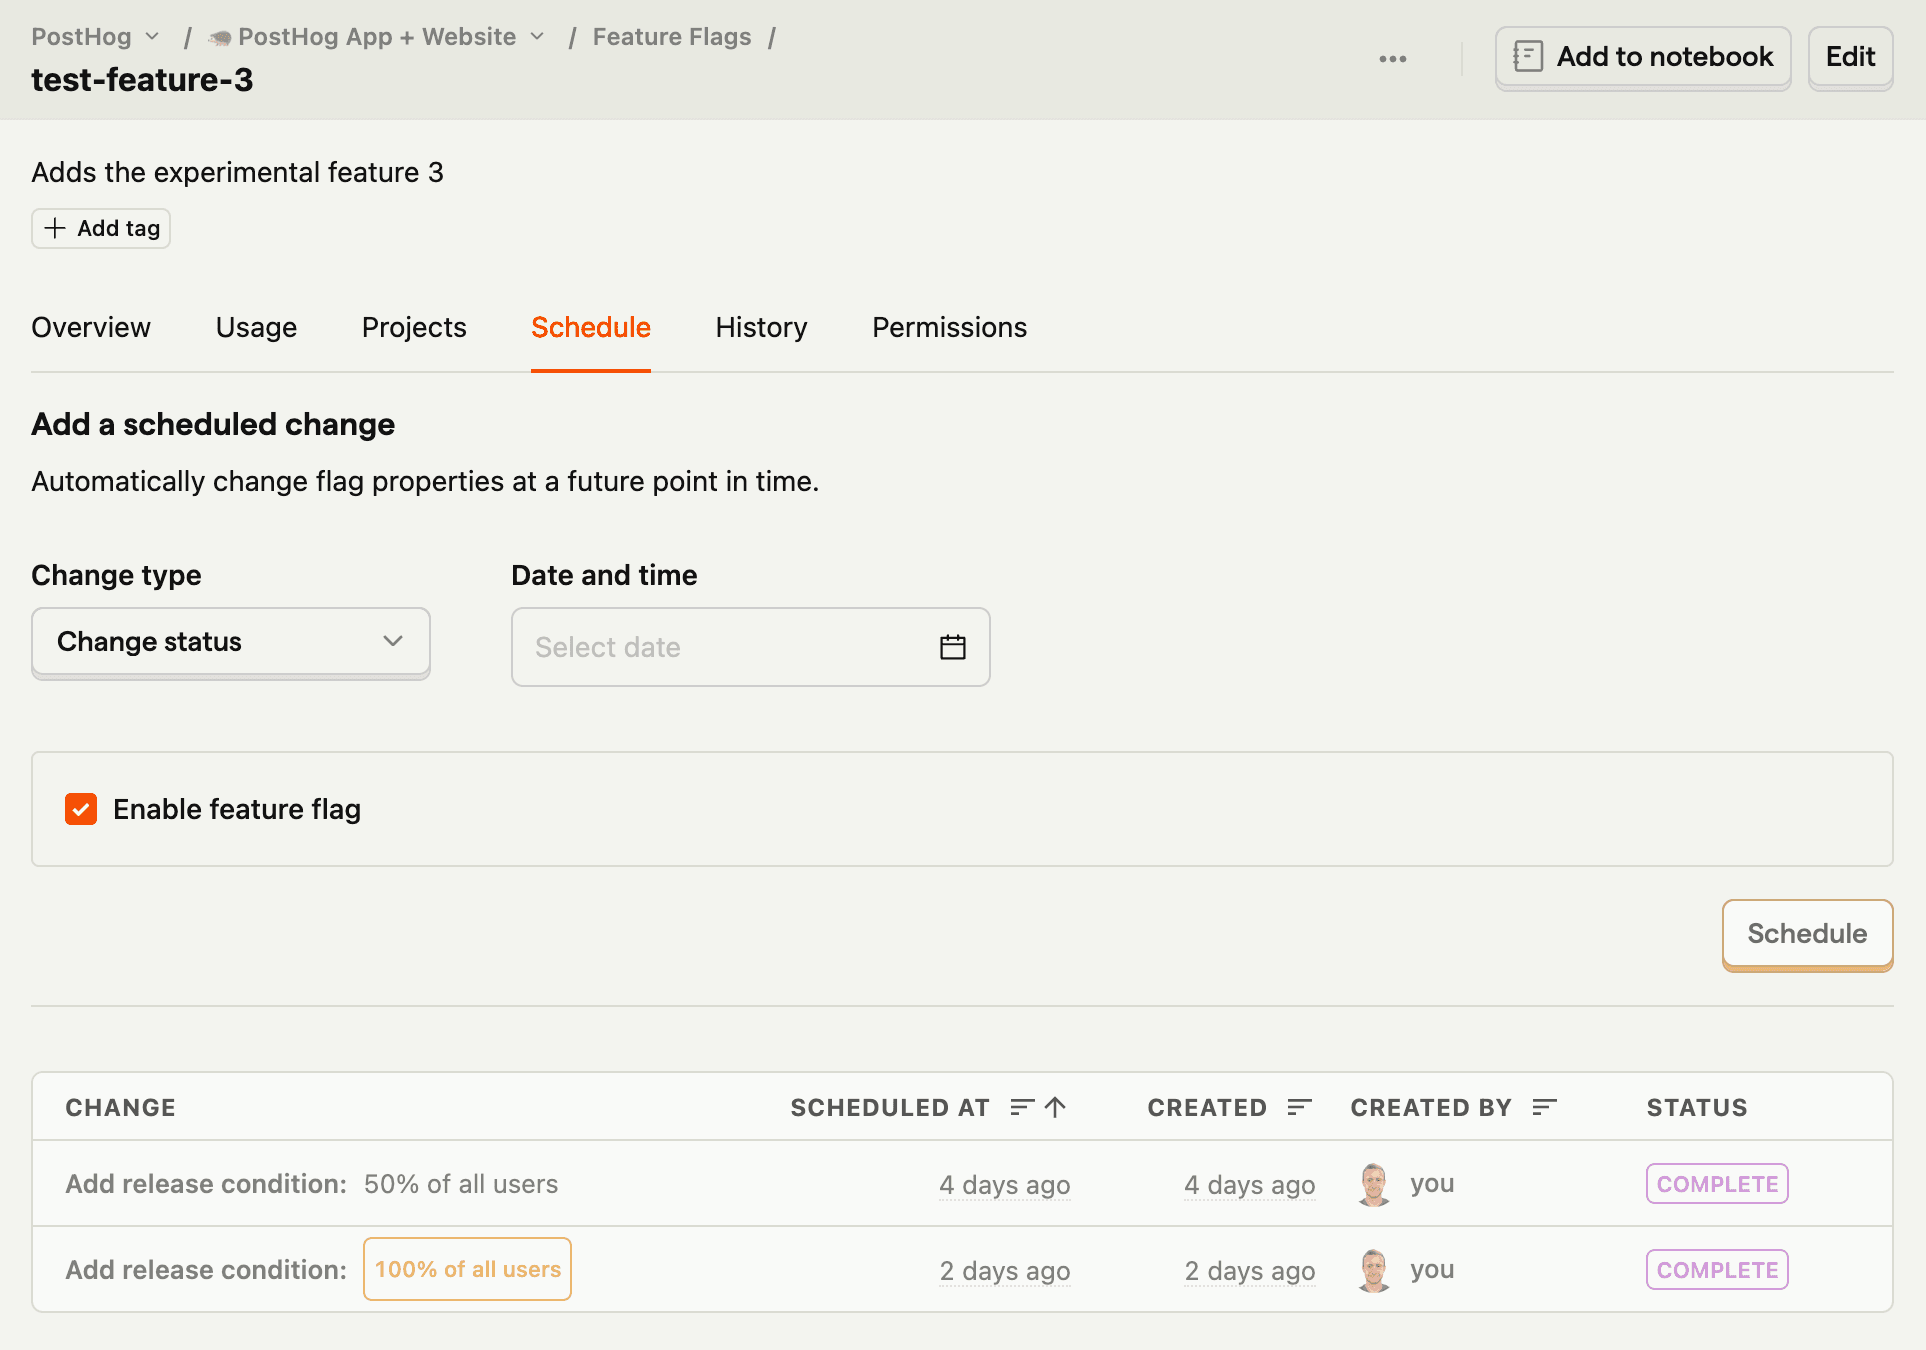
We've added the ability to schedule feature flags properties in PostHog, meaning you can now enable, disable, or change the rollout conditions of a flag automatically.
Scheduled flag changes are especially useful if your release schedules fall outside of normal working hours, or if you work with remote teams in other timezones. They're also useful for coordinating product launches in line with marketing activities or announcements.
You can even add multiple scheduled changes to a single flag, which is handy if you want to organize staggered rollouts.
In-app status indicator added
Infrastructure Team
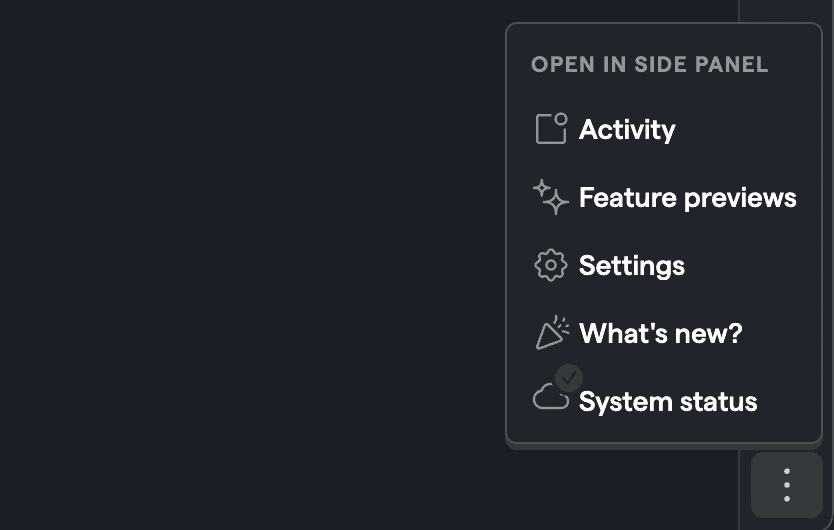
We try our best to make PostHog as stable and reliable as possible but, to quote our handbook, "Incidents are going to happen."
When they do, we want to be as transparent and communicative as possible - that's why we've added a in-app status indicator to the overflow menu in the sidebar. You can click it to go to our full status page for more information.
We hope you'll never need to check on the system status, and that the icon will never be anything other than green, but...well, the handbook is usually right.
Project-based routing added
Infrastructure Team
We have, after more than a year of planning and distractions, added project-based routing into both US and EU environments. Your project ID is now always stored in the URL.
This is a major benefit for teams who have multiple PostHog projects set up because it makes links properly shareable with colleagues. You'll no longer get lost if you click a link from one project while logged in to a different project.
Pricing & billing
Data pipeline add-on launched
Growth Team
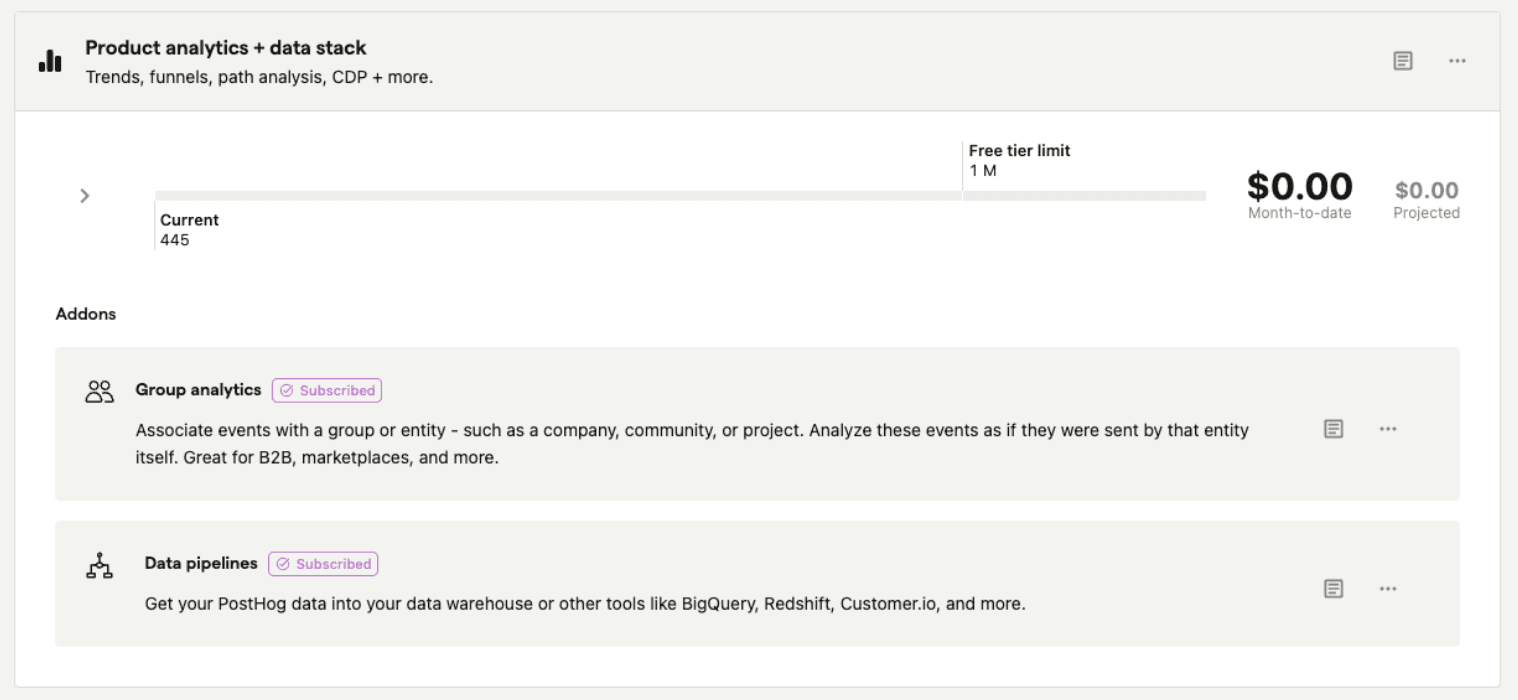
In order to better reflect the growing scope of our export functionality, and to give you more control over your bill, we've split batch exports out into their own add-on product: data pipelines.
If you're an existing user then we've automatically enabled the add-on to avoid disruptions for your product. Your bill won't increase as a result because of the way we've balanced the pricing for both the add-on and product analytics.
If you're a new user you'll need to enable the add-on from your billing page. As always, pricing is based on usage.
We originally included export functionality as part of product analytics because it made it easier to get started with both features. However, that also meant we were more expensive for users who didn't use exports. Our hope is that splitting exports into an add-on will give you more control over how you use PostHog.
Session replay
Network payload capture beta launched
Replay Team
We've already released the first public beta of 2024, which is now accessible via the feature previews menu in PostHog.
Network payload capture is a beta for session replay which, as the title suggests, adds the ability to capture network request and response payload and headers. This is in addition to the network calls and performance data we already capture using
PerformanceObserver.The idea is that capturing requests, responses, and status codes would help you understand application behaviour and performance more thoroughly.
As always we'd love to hear your feedback and thoughts on the GitHub issue!
Feature flags
Automated/scheduled rollouts of feature flags
Feature Success Team
With automated rollouts, you will be able to roll out a feature flag gradually based on a pre-defined schedule.